Attention: Here be dragons
This is the latest
(unstable) version of this documentation, which may document features
not available in or compatible with released stable versions of Godot.
Checking the stable version of the documentation...
Tracing Profilers
Godot currently supports two tracing profilers: Tracy and Perfetto.
In order to use either of them, you'll need to build the engine from source.
If you've never done this before, please read
these docs for the platform you want to profile on.
You'll need to perform the same steps here, but with some additional arguments
for scons.
Tracy for Windows, Linux, and macOS
Tracy is an Open Source profiler that runs on a wide variety of platforms, including Windows, Linux, and macOS. While it is primarily a tracing profiler, it can also periodically sample data like a sampling profiler, giving some of the benefits of both approaches.
Build Godot with Tracy support
First, clone the latest version of the Tracy source code ("0.13.0" at the time of writing) using Git:
git clone -b v0.13.0 --single-branch https://github.com/wolfpld/tracy.git
This will create a tracy directory - you can place this anywhere.
Next, build the release templates for your platform using scons, but adding
the profiler=tracy profiler_path=path/to/tracy arguments with the real path
to the tracy directory, as well as debug_symbols=yes to allow Tracy's
sampling features to work.
备注
You don't have to build release templates, you could also build debug templates, or even the editor. However, it's generally recommended to profile release templates, because that is the version your players will use, and it will perform differently than other types of builds.
For example, to build release templates for Windows:
scons platform=windows target=template_release debug_symbols=yes profiler=tracy profiler_path=path/to/tracy
Get the Tracy "server"
In Tracy terminology, the application you are profiling is the "client", and the one receiving the data is the "server".
If you are on Windows, you can download a pre-built tracy-profiler.exe
from the Tracy releases page.
However, if you're on Linux or macOS, you'll either need to find a pre-built
binary from a package manager (like brew or nix), or build it from
source yourself.
备注
If you do use a pre-built binary, be sure to use the same version that you used when building Godot.
Build the Tracy server from source
In order to build Tracy, you'll need to install cmake, which can be
downloaded from the CMake website, or
possibly installed via a package manager (like brew or nix).
The full instructions for building Tracy from source can be found in the Tracy manual, but here is the TL;DR:
# On Linux, Tracy uses Wayland by default, so if you use X11 add -DLEGACY=1
cmake -B profiler/build -S profiler -DCMAKE_BUILD_TYPE=Release
cmake --build profiler/build --config Release --parallel
This will place the binary at tracy/profiler/build/tracy-profiler or
tracy/profiler/build/tracy-profiler.exe (on Windows).
Record a trace
Launch the Tracy server - you'll see something like this:
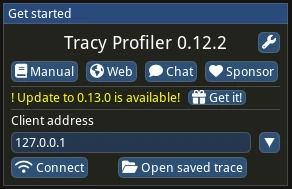
Press "connect". This will ensure tracy makes a connection immediately when
the game launches. If you forget to press "connect", Tracy will store system
events in RAM, which can quickly blow up your memory usage (see the
TRACY_ON_DEMAND documentation).
Now, export your game using the release templates you built above, and run it. As soon as both are running, and you have pressed the "Connect" button in Tracy, you'll see data coming in:
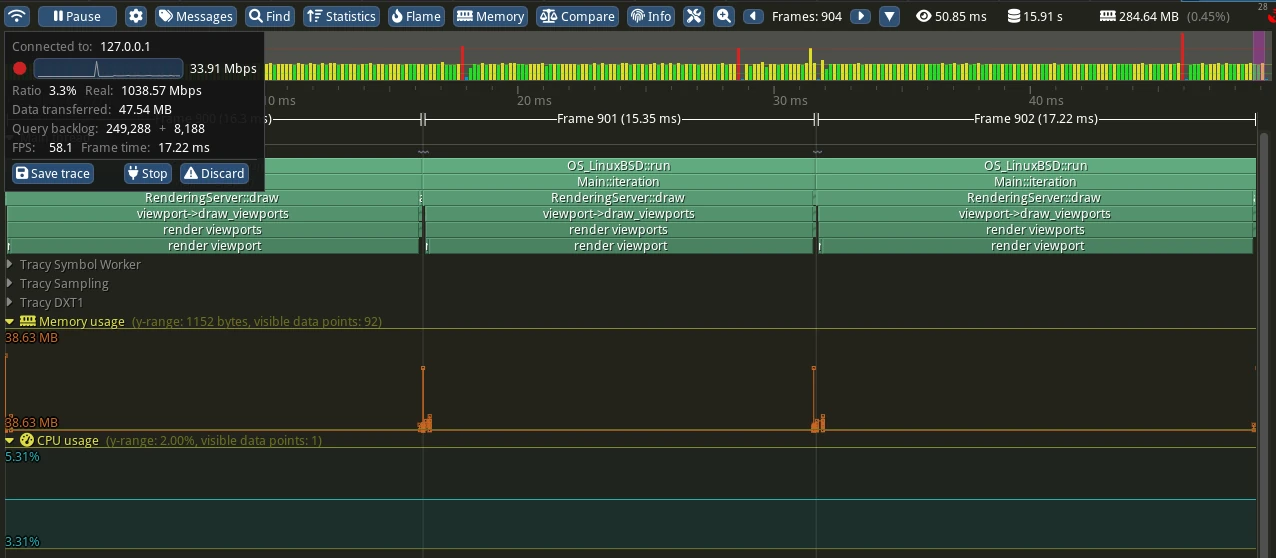
When you think you've gathered enough data, press the "Stop" button. If you clicked somewhere and the box with the "Stop" button disappeared, you can click the top-left most icon to bring it back.
Examining the trace
Here are some of the basic controls:
Zoom in/out with the mouse wheel
Right click and drag to move forward/backward on the timeline
In the top bar, click the left and right arrow buttons by "Frames" to move a single frame on the timeline
To learn more, see the Tracy manual.
Perfetto for Android
Perfetto is the default tracing system for Android. In fact, its system tracing service has been built into the platform since Android 9.
Build Godot with Perfetto support
First, clone the latest version of the Perfetto source code ("53.0" at the time of writing) using Git:
git clone -b v53.0 --single-branch https://github.com/google/perfetto.git
This will create a perfetto directory - you can place this anywhere.
Next, build the Android debug or release templates for your architecture using
scons (per Compiling for Android), but
adding the profiler=perfetto profiler_path=path/to/perfetto arguments with
the real path to the perfetto directory.
备注
It's generally recommended to profile release templates, because that is the version your players will use, and it will perform differently than other types of builds. However, in the case of Android, it can sometimes be useful to use debug templates, because Godot can only do remote debugging of games exported from debug templates.
For example, to build the release templates for arm64:
scons platform=android target=template_release arch=arm64 generate_android_binaries=yes profiler=perfetto profiler_path=path/to/perfetto
Configuration
Perfetto requires a configuration file to tell it which events to track.
Create a file called godot.config inside of the perfetto directory
with this content:
# Trace for 10 seconds.
duration_ms: 10000

buffers {
    size_kb: 32768
    fill_policy: RING_BUFFER
}

# Write to file once every second to prevent overflowing the buffer.
write_into_file: true
file_write_period_ms: 1000

# Track events in the "godot" category.
data_sources {
    config {
        name: "track_event"
        track_event_config {
            enabled_categories: "godot"
        }
    }
}
Record a trace
Finally, launch your game on an Android device using the export templates you built earlier.
When you're ready to record a trace (for example, when you've hit the part of your game that is exhibiting performance issues), you can use this script that comes with the Perfetto source code:
cd perfetto
./tools/record_android_trace -c godot.config
This will record for 10 seconds (per the configuration), or until you press Ctrl + C.
Examining the trace
As soon as that script exits, it will launch the Perfetto UI in a web browser.
To see the Godot events, expand the row for your application by clicking on its Android "Unique Name" (Perfetto will also include some events from system services in the trace).
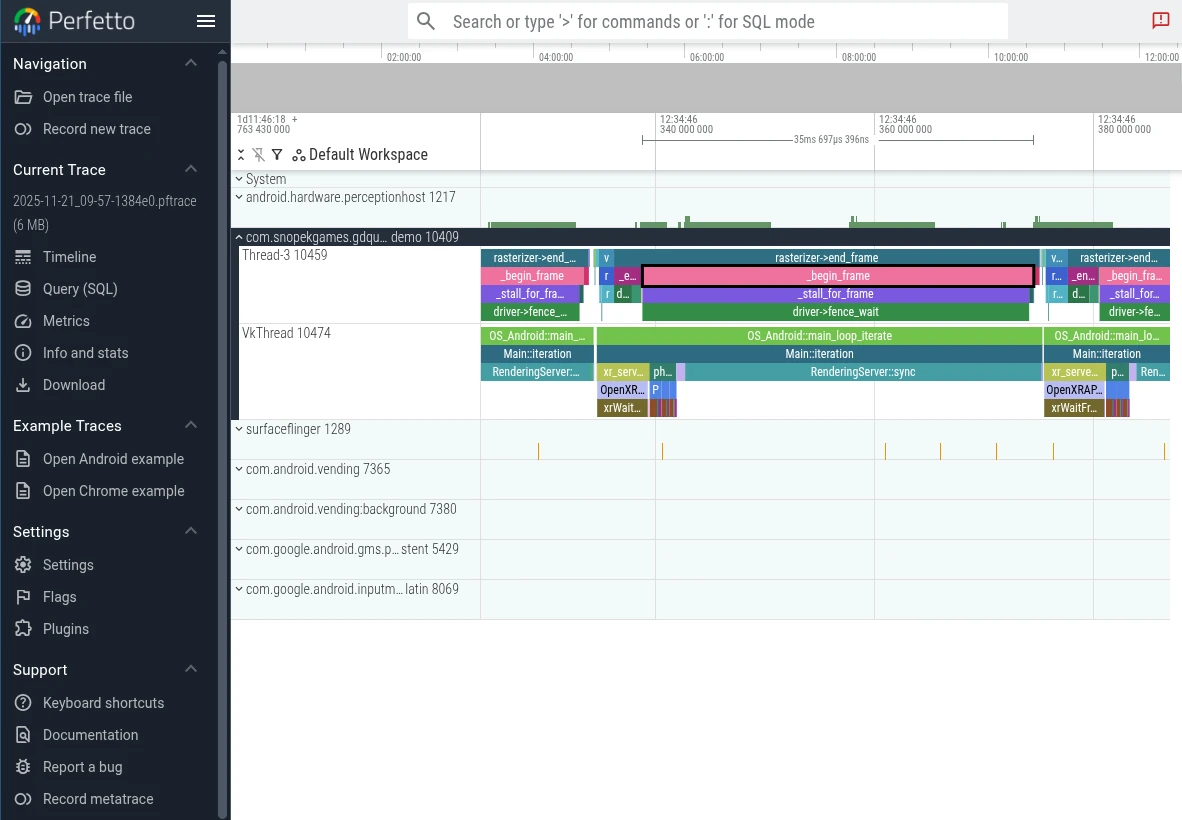
Then you can use the WASD keys to navigate the graph:
Press A or D to navigate forward or backward along the timeline
Press W or S to zoom in or out
You'll probably need to zoom a bit before you're able to see the individual events from Godot.
To learn more, see the Perfetto UI documentation.